A Comprehensive Guide to Using Sequence Diagrams for Identifying Potential Issues in System Design
Unified Modeling Language (UML) sequence diagrams are a powerful tool in the realm of software development and system design. They provide a visual representation of how objects interact in a particular scenario of a use case, illustrating the sequence of messages exchanged between these objects over time. This dynamic view is crucial for understanding the behavior of a system, identifying potential issues, and ensuring that all components work together seamlessly.
Sequence diagrams are part of the broader UML framework, which is widely used for modeling and documenting software systems. They are particularly valuable for their ability to capture the temporal aspects of interactions, showing not just what messages are sent, but also the order in which they occur. This makes them indispensable for analyzing and optimizing complex systems, where the timing and sequence of operations can significantly impact performance and functionality.
In this article, we will delve into the significance of sequence diagrams, their key components, and how they can be effectively used to enhance system design, improve communication among stakeholders, and facilitate the testing and debugging process. Whether you are a seasoned developer or new to the field, understanding sequence diagrams can greatly enhance your ability to design and analyze software systems efficiently.
What Are Sequence Diagrams?
Sequence diagrams are a type of UML (Unified Modeling Language) diagram that depict the dynamic behavior of a system. They illustrate the sequence of interactions between objects, actors, or components in a specific scenario or use case. Key elements include:
- Actors: External entities (e.g., users or systems) interacting with the system.
- Objects: Components or classes within the system.
- Messages: Communications or calls between actors and objects, shown as arrows.
- Lifelines: Vertical lines representing the existence of an object over time.
By presenting these interactions chronologically, sequence diagrams serve as a powerful tool for understanding system workflows and pinpointing areas of concern.
Why Sequence Diagrams Matter for Identifying Issues
Sequence diagrams go beyond mere documentation—they actively support the identification and resolution of potential issues in a system. Below are the primary ways they contribute to this process, along with practical insights on how to leverage them effectively.
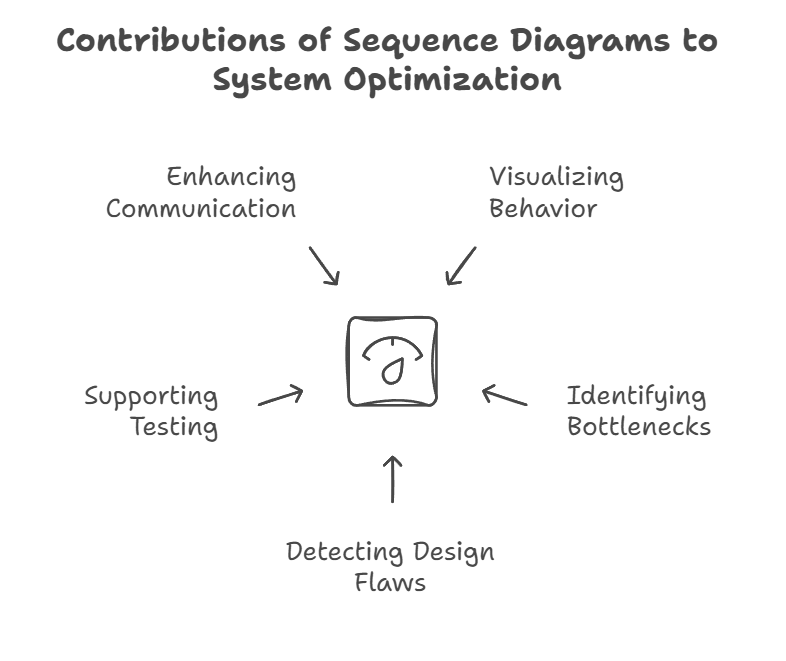
1. Visualizing System Behavior
How It Helps
Sequence diagrams provide a bird’s-eye view of how a system operates by showing the step-by-step flow of messages and interactions. This visual clarity makes it easier to understand complex processes and spot irregularities that might not be apparent in textual descriptions or code alone.
Practical Application
- Example: Imagine designing an e-commerce checkout system. A sequence diagram could illustrate the interactions between the user, shopping cart, payment gateway, and inventory system. By visualizing this flow, you might notice delays caused by excessive back-and-forth communication between components.
- Benefit: Early visualization helps developers and designers assess whether the system behaves as intended and identify areas where the workflow feels cumbersome or illogical.
Tip
Use annotations or notes in the diagram to highlight critical interactions or assumptions, making it easier to discuss potential issues with your team.
2. Identifying Bottlenecks and Inefficiencies
How It Helps
By tracing the sequence of messages, developers can detect inefficiencies such as redundant calls, unnecessary steps, or overly complex interactions that slow down the system. These bottlenecks often translate into performance issues if left unaddressed.
Practical Application
- Example: In a cloud storage service, a sequence diagram might reveal that the client application sends multiple authentication requests to the server before uploading a file. Streamlining this into a single request could significantly improve efficiency.
- Benefit: Highlighting these inefficiencies allows teams to optimize message flows, reducing latency and resource consumption.
Tip
Look for patterns like repeated loops or excessive dependencies between objects—these are common red flags for performance bottlenecks.
3. Detecting Design Flaws Early
How It Helps
Sequence diagrams expose design flaws by making it easy to trace the logic of interactions. Inconsistencies (e.g., missing steps), redundancies (e.g., duplicate actions), or overly complicated workflows become apparent when laid out visually.
Practical Application
- Example: In a ride-sharing app, a sequence diagram might show that the driver assignment process involves an unnecessary confirmation step from the user, which could be eliminated to simplify the design.
- Benefit: Early detection of such flaws allows teams to refine the system architecture before implementation, saving time and effort.
Tip
Compare the diagram against system requirements or user stories to ensure all necessary interactions are present and no extraneous ones creep in.
4. Supporting Testing and Debugging
How It Helps
Sequence diagrams act as a blueprint for how the system should behave, making them an invaluable reference during testing and debugging. By comparing the diagram to the actual system behavior, developers can quickly spot deviations or errors.
Practical Application
- Example: During testing of an online banking system, a sequence diagram might show that a transaction should trigger a confirmation email. If the email isn’t sent, the diagram helps pinpoint whether the issue lies in the message trigger or the email service itself.
- Benefit: This approach increases fault detection rates and reduces debugging time by providing a clear roadmap.
Tip
Use the diagram to create test cases that cover each interaction, ensuring comprehensive validation of the system.
5. Enhancing Communication and Collaboration
How It Helps
Sequence diagrams bridge the gap between technical and non-technical stakeholders by offering a visual, intuitive representation of system behavior. This shared understanding helps teams identify misunderstandings, align expectations, and resolve knowledge gaps early.
Practical Application
- Example: When presenting a new feature to stakeholders, a sequence diagram can clarify how a user’s request flows through the system, prompting questions like, “Why does this step take so long?” or “Can we simplify this process?”
- Benefit: Improved collaboration leads to fewer surprises during development and a more cohesive final product.
Tip
Keep diagrams simple and focused on a single scenario to avoid overwhelming non-technical team members, while providing detailed versions for developers.
How to Create Effective Sequence Diagrams
To maximize their utility in identifying issues, follow these best practices:
- Define the Scope: Focus on a specific use case or scenario (e.g., “User logs in” or “Order is processed”) to keep the diagram manageable.
- Identify Key Participants: Include only the actors and objects directly involved in the interaction.
- Map Interactions Chronologically: Use arrows to show the sequence of messages, including synchronous (immediate response) and asynchronous (delayed response) calls.
- Highlight Exceptions: Add alternative flows (e.g., error handling) to anticipate potential failure points.
- Iterate and Refine: Update the diagram as the design evolves to reflect changes and new insights.
Real-World Example: Cloud Storage System
Let’s apply these principles to a cloud storage service:
- Actors: User, Client App.
- Objects: Authentication Service, Storage Server.
- Sequence:
- User initiates file upload via Client App.
- Client App requests authentication from Authentication Service.
- Authentication Service validates and returns a token.
- Client App sends the file and token to Storage Server.
- Storage Server confirms upload success.
Potential Issues Identified:
- If the Authentication Service is called repeatedly for every file, this could be a bottleneck (Solution: Use a session token).
- If the Storage Server doesn’t send a failure message on error, the user might assume the upload succeeded (Solution: Add error handling).
By addressing these issues early, the system becomes more efficient and reliable.
Why Visual Paradigm Could Be a Great Choice
Visual Paradigm is widely regarded as a robust and versatile tool for UML modeling, including sequence diagrams. Here’s why it might be an excellent option for you:
- Comprehensive UML Support: Visual Paradigm supports all 14 UML 2.x diagram types, including sequence diagrams, making it a one-stop solution for complete system modeling. This is ideal if you’re working on complex projects requiring multiple diagram types.
- Intuitive Sequence Diagram Editor: Its drag-and-drop interface, combined with features like Resource Catalog, sweeper, and magnet tools, makes creating and editing sequence diagrams fast and precise. For example, you can easily add messages or adjust spacing without tedious manual adjustments.
- Collaboration and Team Features: It offers team collaboration tools, version control, and the ability to publish diagrams online for feedback. This is a big plus if you’re working with others or need stakeholder input.
- Code Engineering: Visual Paradigm can generate sequence diagrams from existing Java code (reverse engineering) and produce code stubs from diagrams (forward engineering). This bridges the gap between design and implementation, saving time for developers.
- Cross-Platform Availability: It works on Windows, macOS, and Linux, ensuring flexibility regardless of your operating system.
- Free Community Edition: For non-commercial use or learning purposes, the Community Edition provides access to core UML features, including sequence diagrams, with no time limits or ads—though it includes a watermark on outputs.
- Additional Features: Beyond UML, it supports BPMN, ERD, ArchiMate, and more, plus extras like report generation and cloud architecture design. This makes it a powerful tool for broader system design needs.
Recommendation
I recommend Visual Paradigm as a top-tier tool for UML and sequence diagrams, especially if:
- You’re working on detailed, professional-grade system designs that require full UML compliance.
- You value integration with code and collaboration with a team.
- You’re comfortable investing time to learn a feature-rich platform or need its advanced capabilities.
If you’re a beginner, working solo, or just need quick, simple diagrams, a lighter tool like Visual Paradigm Online might suffice. However, for a comprehensive UML experience—particularly for sequence diagrams—Visual Paradigm Desktop’s combination of usability, power, and versatility makes it a standout choice. Start with the free Community Edition to test it out; if it meets your needs, the paid versions unlock even more potential.
Conclusion
Sequence diagrams are an essential tool in system design and development, offering a clear and structured way to visualize the interactions between objects or components over time. By mapping out the flow of messages and events, they provide invaluable insights into how a system behaves, enabling developers, designers, and stakeholders to identify and address potential issues early in the process. This comprehensive guide explores how sequence diagrams contribute to spotting problems, optimizing performance, and ensuring robust system design.
Sequence diagrams are more than just a design artifact—they are a proactive tool for identifying and resolving potential issues in a system. By visualizing behavior, highlighting inefficiencies, detecting flaws, supporting testing, and fostering collaboration, they empower teams to build robust, optimized solutions. Whether you’re designing a simple application or a complex distributed system, incorporating sequence diagrams into your workflow can save time, reduce errors, and improve overall quality.