Sequence Diagrams vs. Other UML Diagrams: A Comprehensive Comparison
Introduction
The Unified Modeling Language (UML) offers a diverse set of diagrams, each tailored to specific aspects of system modeling. Among these, sequence diagrams stand out for their focus on dynamic interactions over time, providing a clear view of how objects collaborate in a given scenario. However, their purpose and structure differ significantly from other UML diagrams, such as activity diagrams, state machine diagrams, class diagrams, system sequence diagrams, and communication diagrams. Understanding these differences is key to selecting the right tool for your modeling needs. This article explores how sequence diagrams compare to these other UML diagrams, highlighting their unique focus, use cases, and strengths.

What Makes Sequence Diagrams Unique?
Sequence diagrams are interaction diagrams that depict the exchange of messages between objects or actors along a vertical timeline. Time progresses downward, and each interaction—represented by horizontal arrows—shows the order and nature of communication. This temporal focus sets sequence diagrams apart, making them ideal for analyzing system behavior in specific scenarios. Unlike static diagrams that define structure or state-based diagrams that track transitions, sequence diagrams capture the “how” and “when” of object interactions, offering a dynamic lens into system operations.
Let’s dive into a detailed comparison with other UML diagrams to clarify their distinctions.
Sequence Diagrams vs. Other UML Diagrams
1. Sequence Diagrams vs. Activity Diagram
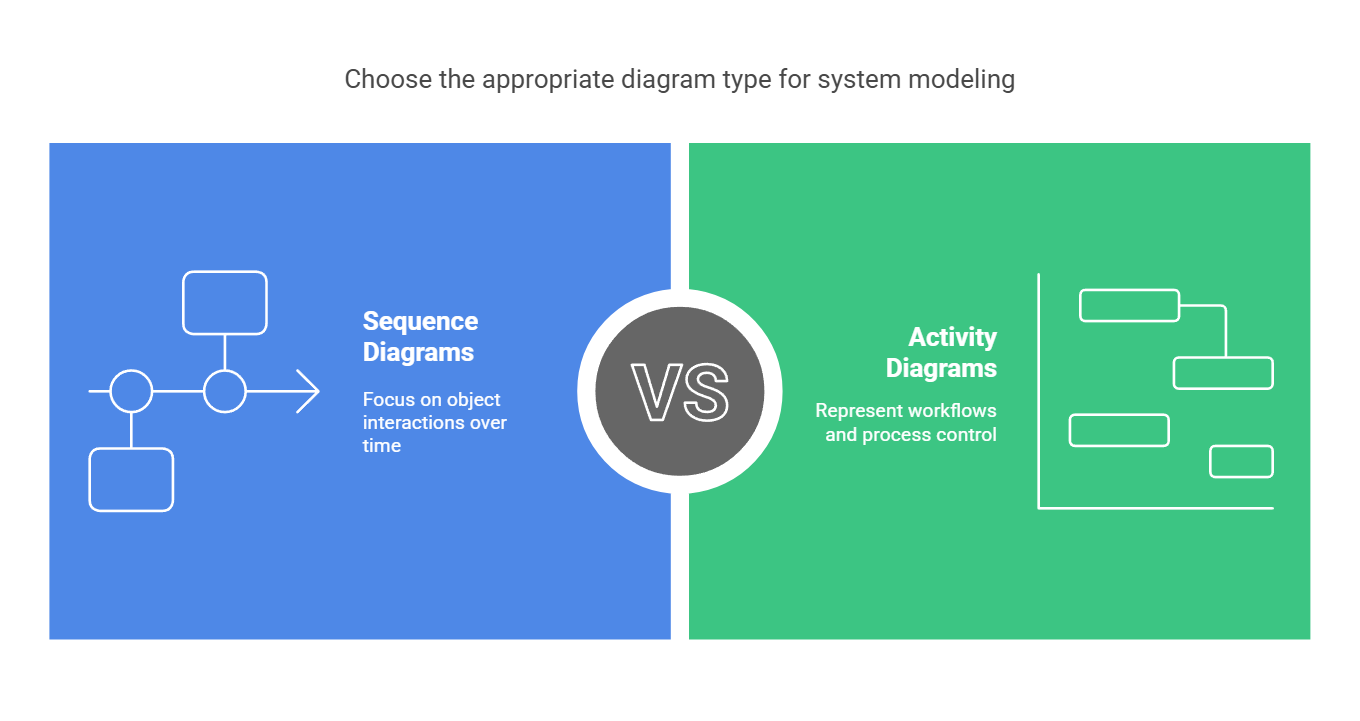
Focus
- Sequence Diagrams: These emphasize the interactions between objects over time, detailing the sequence of messages exchanged. They answer questions like, “What messages are sent, and in what order?”
- Activity Diagrams: These represent workflows and processes within a system, focusing on the control flow between activities. They illustrate the steps, decisions, and parallel actions in a process.
Key Differences
- Sequence diagrams are object-centric, showing communication between participants.
- Activity diagrams are process-centric, abstracting away individual objects to focus on the flow of activities.
Use Case
- Sequence Diagrams: Perfect for detailing how objects collaborate in a specific scenario, such as a user withdrawing cash from an ATM.
- Activity Diagrams: Ideal for modeling complex workflows, such as the entire process of handling a customer order, including conditional logic and parallel tasks.
Example
Imagine modeling an online purchase:
- A sequence diagram would show the User sending “Add to Cart” to the System, followed by a “Confirm Payment” message.
- An activity diagram would map the broader workflow: “Browse Products” → “Add to Cart” → “Checkout” → “Process Payment,” with decision points like “In Stock?”
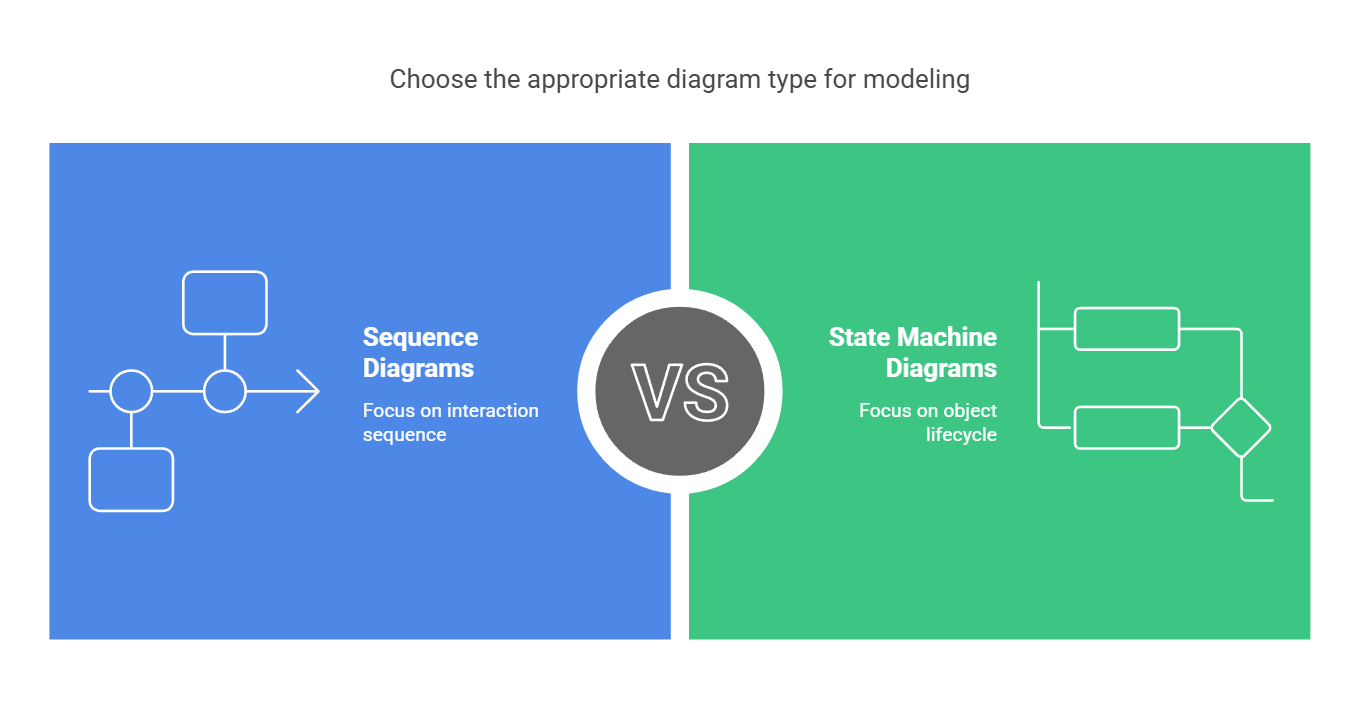
2. Sequence Diagrams vs. State Machine Diagram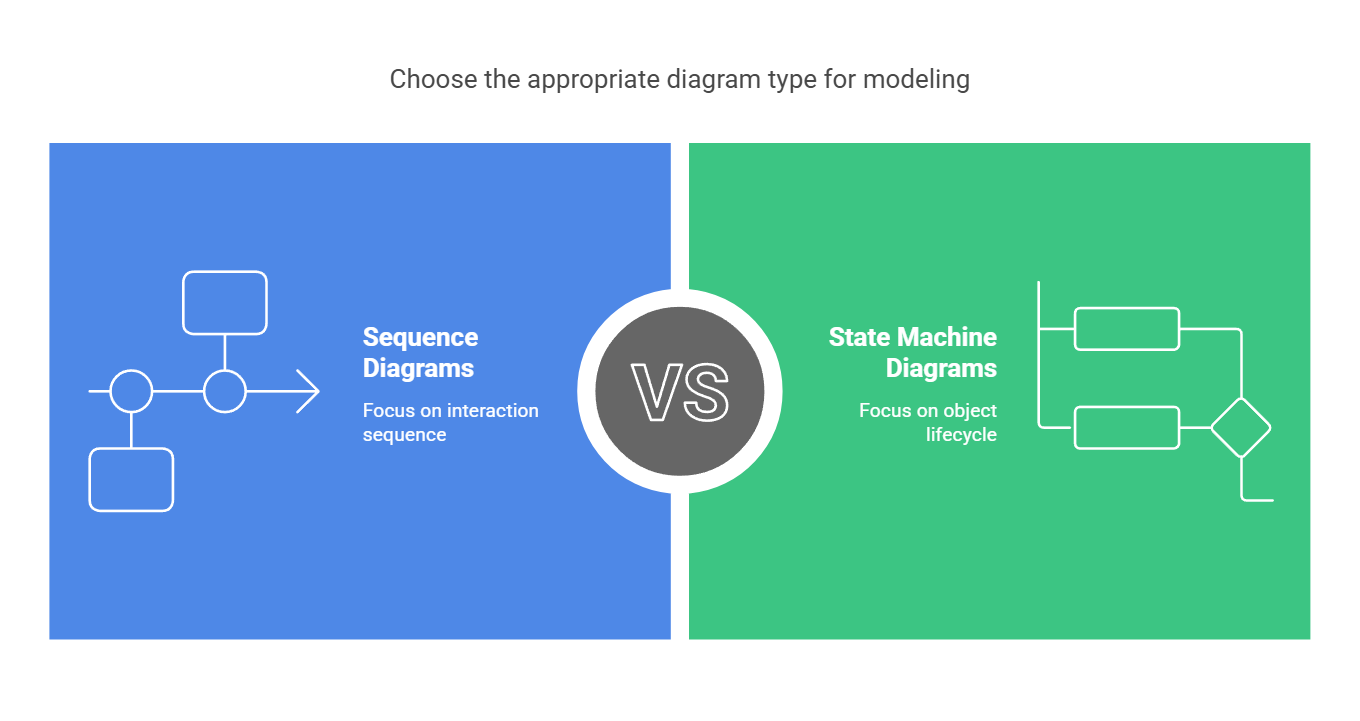
Focus
- Sequence Diagrams: These highlight the sequence of interactions between objects, focusing on message flow over time.
- State Machine Diagrams: These focus on an object’s lifecycle, showing its possible states (e.g., “Idle,” “Processing”) and the transitions between them triggered by events.
Key Differences
- Sequence diagrams capture external interactions, ignoring internal state changes.
- State machine diagrams track an object’s internal behavior, independent of other objects’ actions.
Use Case
- Sequence Diagrams: Used to understand dynamic interactions, like a login process involving a User, Interface, and Authenticator.
- State Machine Diagrams: Used to model an object’s behavior, such as an ATM transitioning from “Idle” to “Card Inserted” to “PIN Entered.”
Example
For an ATM:
- A sequence diagram shows Customer → :ATM: “Insert Card,” followed by :ATM → :Bank: “Verify.”
- A state machine diagram shows the :ATM moving from “Idle” to “Card Inserted” upon receiving the “Insert Card” event.
3. Sequence Diagrams vs. Class Diagrams
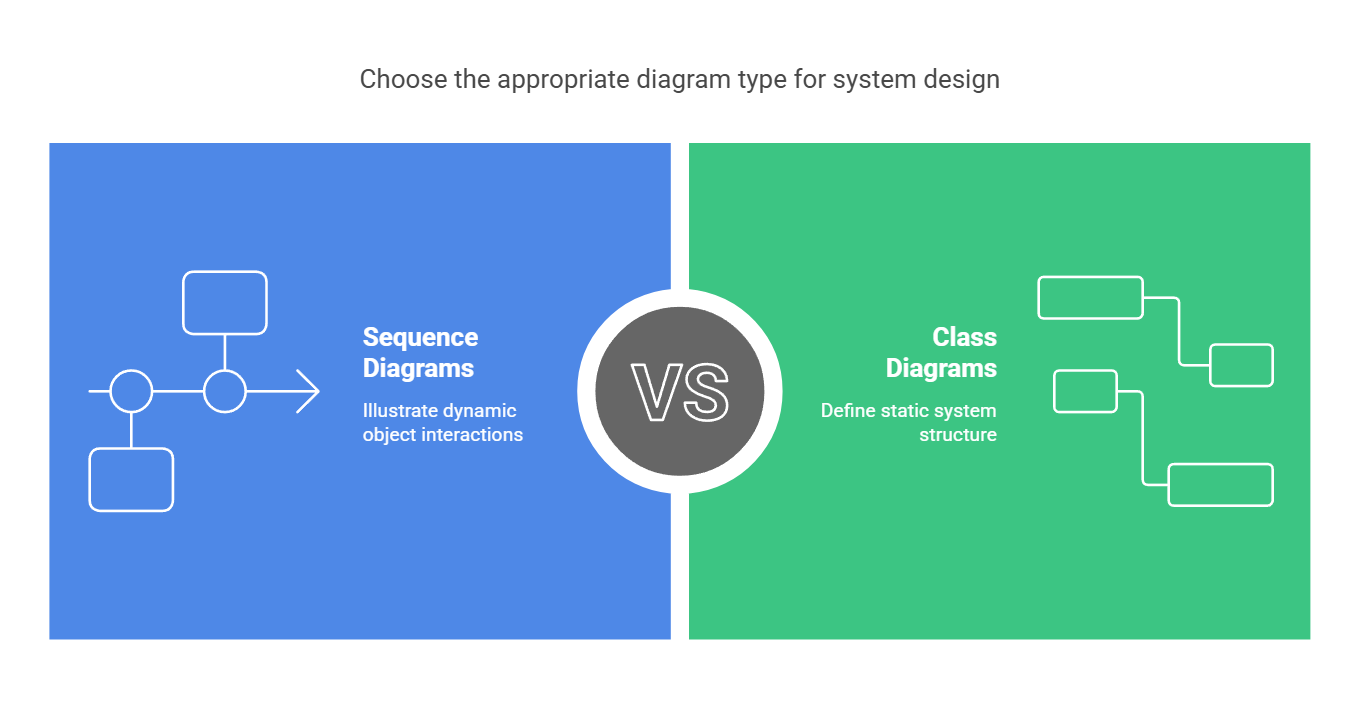
Focus
- Sequence Diagrams: These illustrate the dynamic behavior of objects, showing how they interact over time through messages.
- Class Diagrams: These define the static structure of a system, detailing classes, their attributes, methods, and relationships (e.g., inheritance, association).
Key Differences
- Sequence diagrams are time-based and behavioral, focusing on execution flow.
- Class diagrams are timeless and structural, providing the blueprint of the system.
Use Case
- Sequence Diagrams: Used to analyze system behavior, such as how a Customer object interacts with an Order object during checkout.
- Class Diagrams: Used to design the system’s architecture, defining that Customer has attributes like name and id, and relates to Order via an association.
Example
In a library system:
- A sequence diagram shows :Librarian → :System: “Check Out Book,” followed by :System → :Database: “Update Record.”
- A class diagram shows Librarian, System, and Database as classes with attributes and relationships, like Librarian “uses” System.
4. Sequence Diagrams vs. System Sequence Diagrams (SSDs)
Focus
- Sequence Diagrams: These delve into internal interactions between objects within a system, detailing how components collaborate.
- System Sequence Diagrams (SSDs): These treat the system as a black box, focusing on interactions between external actors and the system as a whole.
Key Differences
- Sequence diagrams reveal the internal dynamics of a system.
- SSDs abstract away internal details, emphasizing external inputs and outputs.
Use Case
- Sequence Diagrams: Used in design and analysis to understand how internal objects (e.g., :Controller, :Database) handle a request.
- System Sequence Diagrams: Used in requirements gathering to define what the system does from an external perspective, such as a User interacting with a System.
Example
For a ticket booking:
- A sequence diagram shows :User → :TicketController → :Database: “Reserve Seat.”
- An SSD shows :User → :System: “Book Ticket,” with :System → :User: “Confirmation,” hiding internal steps.
5. Sequence Diagrams vs. Communication Diagrams
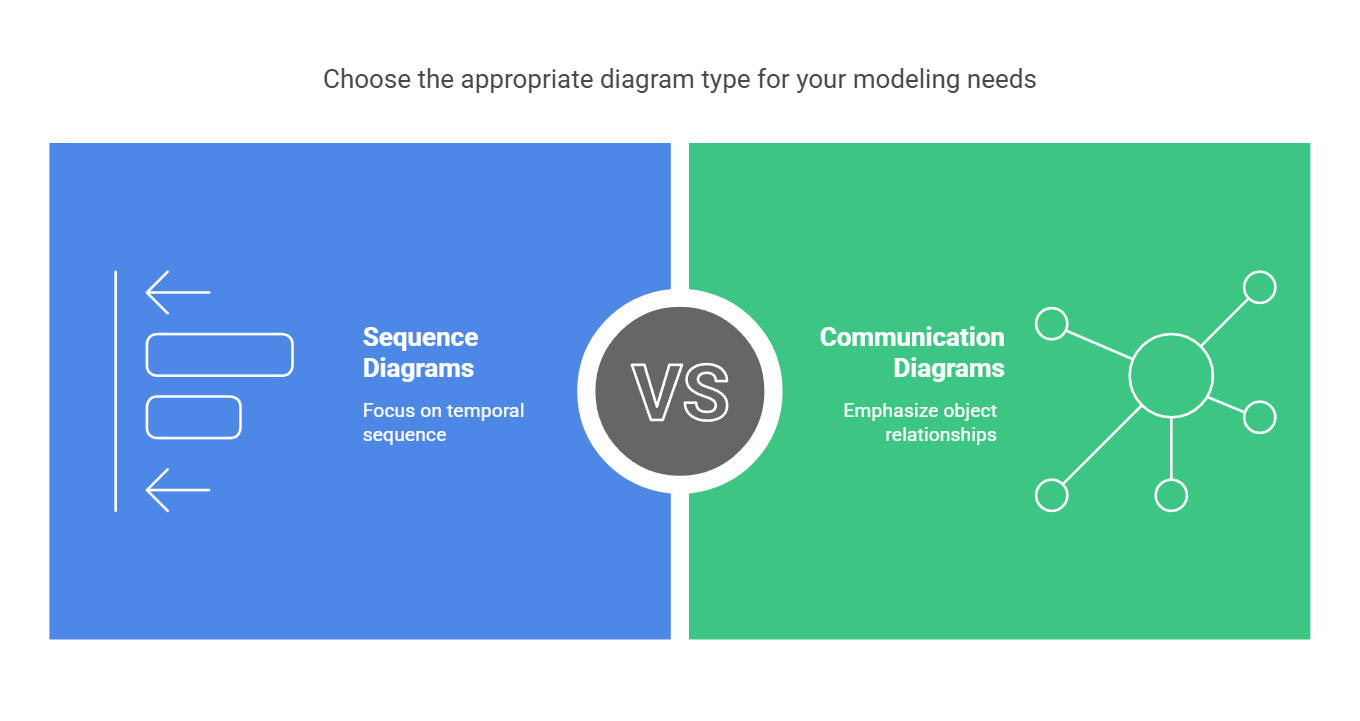
Focus
- Sequence Diagrams: These prioritize the temporal sequence of interactions, using a vertical timeline to show when messages occur.
- Communication Diagrams: These emphasize the relationships between objects, showing message flows as numbered links without a strict time axis.
Key Differences
- Sequence diagrams focus on the “when” of interactions, with time explicitly progressing downward.
- Communication diagrams focus on the “who” and “what,” highlighting object connections over timing.
Use Case
- Sequence Diagrams: Preferred when timing and order are critical, such as modeling a real-time transaction process.
- Communication Diagrams: Better for showing structural relationships and message paths, like a network of objects in a system.
Example
For a login process:
- A sequence diagram shows :User → :LoginPage: “Submit Credentials,” then :LoginPage → :Authenticator: “Verify,” in chronological order.
- A communication diagram shows numbered messages (e.g., 1: “Submit Credentials,” 2: “Verify”) between :User, :LoginPage, and :Authenticator, focusing on links rather than time.
Summary of Key Differences
| Diagram Type | Focus | Time-Based? | Use Case |
|---|---|---|---|
| Sequence Diagram | Object interactions over time | Yes | Dynamic behavior in scenarios |
| Activity Diagram | Workflow and control flow | No | Complex processes and workflows |
| State Machine Diagram | Object states and transitions | No | Object lifecycle behavior |
| Class Diagram | Static system structure | No | System architecture and relationships |
| System Sequence Diagram | External system interactions | Yes | Requirements and external flows |
| Communication Diagram | Object relationships and messages | No | Structural message flow |
Why Sequence Diagrams Matter
Sequence diagrams are uniquely suited to modeling the temporal sequence of interactions, making them invaluable for:
- Behavioral Analysis: Understanding how a system responds to inputs over time.
- Scenario Detailing: Breaking down use cases into actionable steps.
- Design Refinement: Translating requirements into detailed object interactions.
Their ability to visualize timing sets them apart from structural diagrams (like class diagrams) and makes them more intuitive for time-sensitive processes than communication diagrams. Meanwhile, their focus on internal dynamics distinguishes them from SSDs, and their object-level granularity contrasts with the process-oriented activity diagrams.
Practical Application: Choosing the Right Diagram
Consider a library management system:
- Use a class diagram to define Book, Librarian, and Borrower with their attributes and relationships.
- Use a sequence diagram to show how :Librarian checks out a :Book to a :Borrower, including messages like “Reserve” and “Confirm.”
- Use an activity diagram to map the entire checkout process, including decision points like “Is Book Available?”
- Use a state machine diagram to track a :Book’s states: “Available,” “Borrowed,” “Overdue.”
- Use an SSD to show a :Borrower interacting with the :LibrarySystem to request a book.
- Use a communication diagram to highlight the network of messages between :Librarian, :System, and :Database.
By selecting the appropriate diagram, you ensure clarity and precision in your modeling efforts.
Recommended UML All-in-One Platform
Visual Paradigm is highly recommended as the best all-in-one UML platform for several compelling reasons:
-
Comprehensive UML Support: Visual Paradigm supports a wide range of UML diagrams, including class diagrams, use case diagrams, sequence diagrams, activity diagrams, and more. This comprehensive support ensures that users can model various aspects of a system effectively 9.
-
User-Friendly Interface: The tool features an intuitive and easy-to-use interface that allows users to create UML diagrams effortlessly. With drag-and-drop functionality, users can quickly add elements to their diagrams without needing extensive training or experience 9.
-
Advanced Features: Visual Paradigm offers advanced features such as inline editing of class members, automatic sequence diagram numbering, and the ability to add and remove space within the diagram using sweeper and magnet features. These advanced capabilities enhance the precision and professionalism of the UML diagrams created 9.
-
Cross-Platform Compatibility: Visual Paradigm is a cross-platform solution that supports Windows, Linux, and Mac. This compatibility ensures that teams working on different operating systems can collaborate seamlessly on the same project 9.
-
Collaboration and Teamwork: Visual Paradigm supports real-time collaboration, allowing multiple users to work on the same diagram simultaneously. This feature is crucial for agile development teams that require efficient and effective communication to stay synchronized and productive 9.
-
Integration with Other Tools: Visual Paradigm integrates seamlessly with other development tools and processes, such as Scrum, EA, and project management processes. This integration helps streamline the entire software development lifecycle, from initial design to final implementation 4.
-
Customization and Flexibility: Users can customize their UML diagrams by incorporating various notations and designing with their own shapes. This flexibility allows for the creation of tailored diagrams that convey specific messages effectively 9.
-
Wide Adoption and Trust: Visual Paradigm is trusted by over 320,000 professionals and organizations worldwide, including Fortune 500 companies, universities, and government sectors. This widespread adoption is a testament to its reliability and effectiveness as a UML modeling tool 7.
-
Continuous Improvement: The tool is regularly updated with new features and enhancements, ensuring that users have access to the latest tools and technologies for UML modeling. This commitment to continuous improvement helps users stay ahead in their software development projects 3.
-
Free and Accessible: Visual Paradigm offers a free community edition that supports over 50 types of diagrams, making it accessible for non-commercial uses such as education, non-profit, and personal projects. This accessibility encourages widespread use and learning of UML modeling 5.
Conclusion
Sequence diagrams shine in their ability to capture the dynamic, time-ordered interactions between objects, setting them apart from other UML diagrams. Whether you’re contrasting their temporal focus with the structural emphasis of class diagrams, the workflow orientation of activity diagrams, or the relational view of communication diagrams, sequence diagrams offer a unique perspective on system behavior. By understanding these differences, you can leverage sequence diagrams effectively—alongside other UML tools—to design, analyze, and communicate complex systems with confidence.
Visual Paradigm‘s comprehensive features, user-friendly interface, advanced capabilities, cross-platform compatibility, collaboration support, integration with other tools, customization options, widespread adoption, continuous improvement, and accessibility make it the best all-in-one UML platform. Whether you are a seasoned developer or a student learning the ropes of software design, Visual Paradigm provides the tools and support needed to create effective and meaningful UML diagrams.